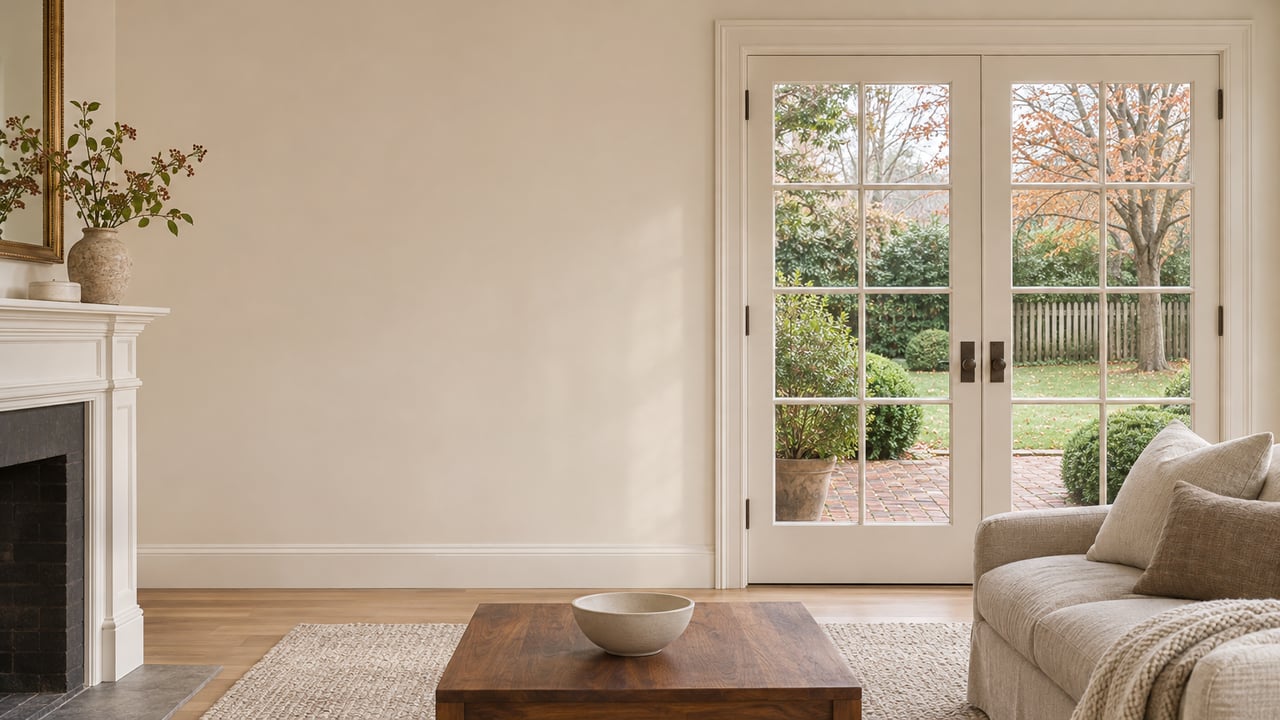
What Kentlands' $3.8 Million Record Means for This Fall's $1.5 Million Homes
November 19, 2026
November 19, 2026
Kentlands and Lakelands set two price records in 2026, and the two sales went in opposite directions against their asking prices. In February, 730 Turtle Pond Lane was listed at $1,550,000 and closed at $1,565,000, above asking, about a week after it hit the market, according to The MoCo Show. Five months later, 127 Thurgood Street sold for $3.8 million after an April list price of $4.25 million. That sale came in about 10.6% below its original ask, The MoCo Show reported in July.
If you are shopping the top of the Kentlands market this winter, the February sale is the closer guide to what you will be paying for. This fall's large-home listings are testing whether the $1.565 million step from February holds for homes that are good but not one of a kind, and county data from October shows buyers taking their time with that question.
For a long stretch the top sale in both neighborhoods sat at $1,530,000. Kentlands reached it with a May 2022 sale that had been listed at $1,475,000, so it closed over ask. Lakelands matched it with an October sale, referenced in the same February report, that had been listed at $1,595,000 and closed under ask.
Turtle Pond moved the ceiling up by $35,000. The listing agent told The MoCo Show that the home was a similar model to others that had recently sold nearby. In her account, its condition, updates, staging, photography and the lot backing to Turtle Pond set it apart, and more than 20 groups came through the open house. That was a familiar floor plan selling at a premium because of how it was kept and where it sat.
Thurgood was different. The MoCo Show's April coverage described a 2020 home of roughly 11,500 square feet on 0.41 acre. The July report adds that Mitchell & Best built it, with four finished levels, an indoor aquatic center with a resistance pool, a wellness wing and a custom wine cellar. Nothing else in either neighborhood is comparable to it.
$3.8 million spread across about 11,500 square feet comes to roughly $330 per square foot. Three Kentlands homes came on the market in October. Two of them ask above the February record, the third asks just under $1.4 million, and all three ask more per square foot than Thurgood sold for:
| Home | Neighborhood | List price, mid-November | Size | Ask per sq ft | Listed |
|---|---|---|---|---|---|
| 132 Treehaven Street | Kentlands | $1,599,900 | 4,651 sq ft | about $344 | Oct. 3, 2026 |
| 121 Selby Street | Kentlands | $1,595,000 | 4,563 sq ft | about $350 | Oct. 23, 2026 |
| 151 Little Quarry Road | Kentlands | $1,399,900 | 3,790 sq ft | about $369 | Oct. 23, 2026 |
| 858 Still Creek Lane | Lakelands | $1,575,000 | 5,974 sq ft | about $264 | Aug. 21, 2026 |
| 617 Bright Meadow Drive | Lakelands | $1,250,000 | 4,272 sq ft | about $293 | Aug. 15, 2026 |
The table reflects the Bright MLS feed as last updated Nov. 11–13, 2026. Status and prices can change before you read this, so take it as a snapshot of mid-November.
Thurgood's buyer paid for a much larger house with amenities no other home in the neighborhood has, and still paid less per foot than these three sellers are asking. Treehaven and Selby would each set a new high for a Kentlands home of ordinary scale if they closed near their asks. Little Quarry sits below that line in total price but has the highest per-foot ask of the group. None of the three can lean on Thurgood as a comparable sale. The closer reference point is Turtle Pond: a recent, comparable floor plan that earned its premium through condition and setting.
The two Lakelands listings have been on the market longer, and their price histories show where the pressure is. 858 Still Creek Lane, an NV Homes Dartmouth model backing to Muddy Branch parkland, came on in August and had a price change on Sept. 10, reported as about 1%. As of the November feed it showed 81 days on market. Its listing also says the sellers are offering a mortgage buydown with a qualified offer to lower the buyer's interest rate, with the amount to be determined. 617 Bright Meadow Drive, built in 2001, came on Aug. 15 and had a price change on Oct. 2, reported as about 4%.
Both homes ask well below the Kentlands trio per square foot and both had already been adjusted by mid-November. The Kentlands listings came on later, at higher per-foot asks, and as of the November feed they had been on the market for weeks rather than months. A buyer touring all five sees two stages of the same process. The August listings have already had their first conversation with the market, and the October listings have not.
The county numbers explain why these price changes are coming in single-digit percentages instead of bidding wars. In October 2026, Montgomery County had 2,407 active listings, according to the Greater Capital Area Association of REALTORS October report. The five-year October average is 1,352. Months of supply stood at 3.1 that month, against a five-year October average of 1.5.
The inventory did not build because more owners listed. October new listings fell 8.2% from October 2025, while new purchase contracts fell 21.4% and closed sales fell 19.0%, according to the October 2026 Washington, D.C. Metro Market Insights report. Active listings rose 27.2% year over year. Homes are coming on at a normal pace and going under contract more slowly.
Prices have barely moved. The October county median of $617,778 was 0.4% below October 2025. The slowdown shows up instead in the gap between original list price and sale price. October's average sale-to-original-list ratio was 96.7%, compared with 97.8% in October 2025 and a five-year October average of 99.4%. Median days on market was 19 in October, compared with 13 a year earlier.
A gap of roughly three points between today's ratio and the five-year norm is about the size of the 1% and 4% price changes on the Lakelands listings. Sellers are holding their prices and adjusting at the margin. Across the broader Washington metro in October, detached homes held up best of the three property types: a $826,000 median, up 2.0% year over year, with 2.68 months of supply. Metro townhomes sat at 3.0 months of supply and condos at 5.15. Large detached homes are still the steadiest part of the market, and that is the segment this tier belongs to.
In 2026 the neighborhood paid a record price for a common floor plan once, and the reasons were condition, presentation and a lot backing to a pond. The listing agent also told The MoCo Show that planning started well before the home went live and that the launch was timed to the start of the spring market. In a county where contracts are down by a fifth, those are the features that can justify a price near the old ceiling.
For a buyer comparing the October Kentlands listings, the useful questions are concrete. How does each home's lot compare with Turtle Pond's private setting? How recent and complete are the updates? Would the home stand up against a similar model that has recently sold nearby? Square footage and the Thurgood headline will not answer those questions. For context on how list prices get set in this neighborhood, our guide to pricing a Kentlands home in any market covers the seller's side, and the Kentlands neighborhood page and Lakelands neighborhood page show current listings.
If you own a large home here and are wondering whether Thurgood changed your number, the per-square-foot math says it changed the ceiling for one kind of house. Our notes on staging and upgrade priorities for Kentlands sellers cover the presentation side that the February sale credited.
Did the $3.8 million sale raise values for other large Kentlands homes? At about $330 per square foot, the Thurgood sale came in below the per-foot asks of the three October Kentlands listings. Its total reflects an 11,500-square-foot house with amenities found nowhere else in the neighborhood, so it does little to support higher per-foot asks on homes a third its size.
Are Kentlands and Lakelands priced the same at the top? In mid-November the three Kentlands listings asked about $344 to $369 per square foot, and the two Lakelands listings asked about $264 to $293. The Lakelands homes are larger and have been on the market longer.
Is this a buyer's market? Montgomery County had 3.1 months of supply in October 2026, about double its five-year October average, with sale-to-original-list at 96.7%. Buyers have more time and more choices than in recent years, and prices have held close to flat.
Weighing a Kentlands or Lakelands home in this tier, or wondering where yours fits after this year's two records? Valerie D Harnois can go through the per-square-foot comparisons on the homes you're considering, room by room and lot by lot. Let's connect.
Stay up to date on the latest real estate trends.
Let me share what I've learned about finding a dream home or selling your existing home on time. I will listen to you and work with you to create a realistic set of goals, formulate a marketing/staging strategy for selling your home, and then, most importantly, keep you informed every step of the way.